Room Acoustics / Concert Hall Acoustics - an Overview
|
Room acoustics describes how room shape, size, and contents influence a listener's sound experience within the room. A sound source produces frequency-dependent sound waves travelling from the source to the listener, reflected and absorbed by furniture and walls. Reflecting waves interact with oncoming waves, resulting in interference patterns.
|
 |
|
Architectural Concepts for Concert Halls
There are three basic types of concert hall architectures: the shoe box, the vineyard and the fan form. The classical halls of the nineteenth century were narrow, high, rectangular shoe boxes. These are halls like the Amsterdam Concertgebouw (1888), the Vienna Musikvereinssaal (1870) and the Boston Symphony Hall (1900).
The second form, the vineyard, is often made of layered terraces or arenas with prominent diffusing upper-reflector surfaces. The audience is divided into smaller sub-seating-areas. These are often asymmetrical and create useful early reflections into all sections of the audience. A typical vineyard hall is the Berlin Philharmonie (1963).
The third form, the fan type, proved unsuccessful nearly everywhere. The audience area widens to the rear to create more space for paid tickets. The outward angled sidewalls cannot provide the necessary side reflections for a appropriate concert hall acoustic. This form was very common in the mid-20th century.
 |
 |
 |
|
Shoebox Concept with
good side reflections |
Fan-Shaped Concept with
missing side reflections
in the center |
Vine-Yard Concept with
a multitude of reflections |
Acoustic Parameters
Reverberation Time
Reverberation Time is the global quantitative criterion of the sound field in the room. Room reverberation gives fullness and richness to the music. The reverberation time must be in the proper range depending on the room size and the style of music. But the acoustic quality of a room for musical performance cannot be evaluated by reverberation time alone. Two rooms with equal reverberation time can sound completely different!
< /td> /td> |  |
| reverberation versus time | reverberation versus frequency |
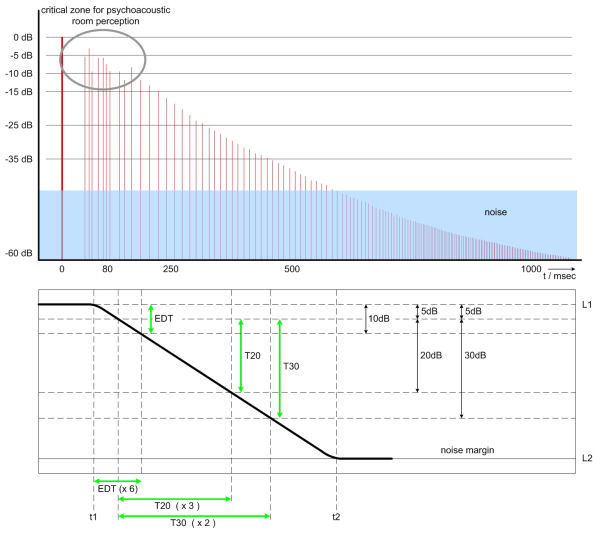
Two types of reverberation time are measured, Early Decay Time (EDT) and Reverberation Time (RT) as T10, T20 and T30.
Early Decay Time EDT (sec)
The EDT is a reverberation time derived from the initial 10 dB of decay. It is the length of time that it takes for the sound to decay 10 dB after the sound source is turned off. EDT more closely corresponds to subjective (!) evaluation of the reverberation then RT because the first arrivals are psychoacoustically more important than the later reverberation range.
The measurement is multiplied by the factor of 6 to make it comparable with RT60.
T10, T20, T30 (sec)
Reverberation time is the time it takes for a loud sound to decay to inaudibility after its source is cut off. It is defined as the level difference of -60 dB. For evaluation of the decay curve (slope) the measurement starts at -5dB to avoid uncertainties within the very first room response. Because the slope (or steepness) is calculated from the measurement, and only a maximum of 30dB is measured (for T30) this 5dB shift doesn't decrease but increases the measurement accuracy.
Reverberation time is evaluated within these three different ranges:
T10 as the decay from -5 to -15 dB
T20 as the decay from -5 to -25 dB
T30 as the decay from -5 to -35 dB
T10 is multiplied with the factor 6, T20 with the factor 3 and T30 with the factor 2 to be comparable with the classical term RT60 (decay over 60 dB).
EDT is the subjectively more important parameter and is strongly related to the perceived reverberance. T20 and T30 are more related to the physical properties of the room.
Clarity C80, C50 (dB)
The measurement of Clarity is the ratio of the energy in the early sound compared to that in the reverberant sound, expressed in dB. Early sound is what is heard in the first 80 msec (C50 - 50 msec) after the arrival of the direct sound. It is a measure of the degree to which the individual sounds stand apart from one another.
If the clarity is too low, the fast parts of the music are not "readable" anymore. C80 is depending on both the architectural and the stage/podium design.
If there is no reverberation in a dead room, the music will be very clear and C80 will have a large positive value. If the reverberation is large, the music will be unclear and C80 will have a relatively high negative value. C80 becomes 0 dB, if the early and the reverberant sound is equal.
Often the values for 500Hz, 1000Hz and 2000Hz are averaged. This will be expressed by the symbol C80(3).
For orchestral music a C80 of 0dB to -4dB is often preferred, but for rehearsals often conductors express satisfaction about a C80 of 1dB to 5dB, because every detail can be heard. For singers, all values of clarity between +1 and +5 seem acceptable. C80 should be generally in the range of -4dB and +4dB.
For speech, in comparison to music, the Clarity will be measured as the ratio of the first 50 msec (C50) instead of 80 msec (C80) for music.
Definition D50 (percent)
Definition is the ration of early sound energy to the total sound energy in Percent (%). It shows the difference of the level at the time range 0 - 50 ms as against the level at integration over the entire time range from zero to the end.
The larger this parameter, the more distinct the sound signal is felt, because it will then be less disturbed by later diffuse sound. In concert hall acoustics it refers to the degree to which individual strands in a musical presentation can be differentiated from each other.
Horizontal Definition defines the degree to which sounds that follow one another stand apart. Vertical Definition defines the degree to which simultaneous sounds can be heard separately.
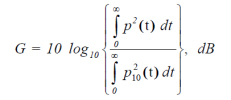
Strength G (dB)
The strength G is defined as the difference (logarithmic ratio) between the sound energy of the measured impulse response to that of the response measured at a distance of 10 meter from the same sound source in a free field. The strength G is related to loudness and should be as uniform as possible throughout the hall. It dependents, inversely, on the total sound absorption of the room. The typical range in performance halls is -2dB to +10dB.
Initial Time Delay Gap ITDG (msec)
The time difference between the arrival of the direct sound and the earliest and most significant reflection (at a listener's seat in the hall), excluding the reflections from the floor. It is measured in msec. It corresponds to the subjective impression of 'intimacy'.
In good halls like the Concertgebouw in Amsterdam and the Boston Symphony Hall, the initial time delay gap is less than 25 ms. In most halls the range is from 25 to 35 ms. Beyond 35 ms halls start sounding like a "too big hall" or an "arena".
Apparent Source Width (ASW) / Early Lateral Energy Fraction (LF) (ratio)
Fraction of energy arriving within the first 80 msec from lateral directions. It is measured with two microphones, one omnidirectional and one figure-eight microphone.


preferred perception angles for early lateral reflections
LFC Lateral Fraction Coefficient
Like LF, but additional with a cosinus function assessed over the angle. It is reproducing the subjective perception better as the parameter LF.
Listener Envelope (LEV) / Late Lateral Energy Fraction (LG) (dB)
Fraction of energy arriving after the first 80 msec from lateral directions. It is also measured with two microphones, one omnidirectional and one figure-eight microphone.
Interaural Cross Correlation Coefficient IACC
To evaluate the spatial property of the sound field, it is the measure of the difference of the sound arriving at the two ears of a listener facing the performing entity in a hall, measured for six octave bands between 125 and 4000 Hz. IACC is usually measured by using a dummy head.
IACC3 is the average of IACC's for the three octave frequency bands with center frequencies of 500, 1000 and 2000 Hz. IACC3 is further divided into early and late components:
IACCE3 indicates integration from t1 = 0 msec to t2 = 80 msec,
IACCL3 from t1 = 80 msec to t2 = 750 msec.
The measured value is between -1 and +1.
The Spaciousness is one of the most important parameter of subjective judging.
Spaciousness has two sub-components: the Apparent Source Width ASW for the early sound and Listener Envelopment LEV by the reverberant sound.
The Apparent Source Width ASW is the apparent auditory width of the sound field created by a performing entity as perceived by a listener in the audience area of a concert hall. It is primarily related to early lateral reflections and low-frequency sound level. The greater the dissimilarity in the sound arriving at the two ears from a single source (the orchestra), the greater is the apparent source width. ASW is related to IACCE3
Listener Envelopment LEV is related mostly to reverberation. It shows how uncorrelated the reverberant sound is that reaches the listener after 80 ms. LEV is related to IACCL3
IACCE3 should be as low as possible. The lowest values in excellent halls are about 0.3.
Bass Ratio, Bass Strength BR
BR is a measure of the support which the reverberation in the hall gives to the low notes of the music. The Bass Ratio was previously declared a counterpart of the subjective criterion "Warmth". It is the ratio of the EDT between low frequencies (octaves 125 and 250 Hz) and medium frequencies (octaves 500 and 1000 Hz). The preferred values of the BR in a concert hall were between 1.1 to 1.25 for halls with high RT's, and 1.1 to 1.45 for halls with RT's of less than 1.8 sec.In todays view, a higher bass ratio tends to hinder clear and clean bass sounds and is preferably avoided, with a bass ratio of 1 being preferred.
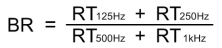 |
bass ratio formula
|
 |
| bass ratio range 125Hz/250Hz + 500Hz/1000Hz |
Envelopment
Envelopment is quantified by the amount of sound that comes not directly from the source. But the total amount of sound that comes on the horizontal plane on a listener's position. Can be displayed in a sound rose, a circular representation of the directions from which a listener receives sound impulses.
A hall with good lateral (side wall) reflections usually has a better feeling of intimacy. Halls are designed with the goal to let the hall sounding as small as possible. That way the audience feels up close and personal with the orchestra.
Intimacy LTDG (msec)
The initial time delay gap measured near the center of the main floor. It is generally determined by the first sound reflection of a side wall or a balcony front after arrival of the direct sound. The music should sound as if heard in a small hall - the listeners should feel an intimate contact with the performers.
Texture
Texture is the subjective impression the listeners derive from the patterns in which the sequence of early sound reflections arrive at their ears. Good texture requires a large number of early reflections, uniformly but not precisely spaced apart, and with no single reflection dominating the others.
Spaciousness
Is supported by early reflections that arrive from near lateral directions.
Diffusion
Every successful hall for music has irregularities, both large and small, on walls, balcony faces and ceilings which create a rich and dense sound structure. Such irregular surfaces diffuse the high frequency portions of the early reflected sound waves, adding patina to the overall sound.
Stage Support
is a measure of strength of orchestral sound returned by nearby reflecting surfaces to the ears of each player in the orchestra, the acoustical support, that a hall gives a player on stage.
Measured as the ratio of the arriving sound energy at the first 10 msec and the arriving sound energy between 20 and 100 msec.
Measurement source is an omnidirectional sound source in a distance of 1 meter. The sound arriving in the later interval has been reflected in the hall and the stage environment already. The measurements are made at several positions and the data are averaged.
RT, ETD, BR, C80, G, IACC and ITDG in Opera Houses (measured by the Takenaka R. & D. Institute and Beranek)
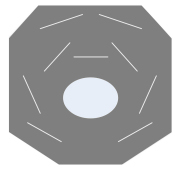
Measurement source: omnidirectional loudspeaker (dodecahedral) on stage, 3 meter from stage edge, center line.
| Hall | V (m3) | Seats | RT, occupied (sec) | EDT, un-
occupied (sec) | BR, occupied | C80(3) (dB) | G (dB) | IACCE3 | ITDG (msec) |
| Amsterdam, Music Theater | 10 000 | 1689 | 1.30 | 1.30 | 1.30 | 1.9 | 1.7 | 0.55 | 32 |
| Berlin, Deutsche Oper | 10 800 | 1900 | 1.36 | 1.60 | 1.30 | 0.7 | 1.2 | 0.39 | 33 |
| Berlin, Komische Oper | 7 000 | 1222 | 1.25 | 1.23 | 1.30 | 3.1 | 6.0 | 0.62 | 20 |
| Budapest, Erkel Theater | 17 000 | 2340 | 1.30 | 1.40 | 1.14 | 3.8 | 3.3 | 0.45 | 17 |
| Budapest, Staatsoper | 8 900 | 1450 | 1.34 | 1.37 | 1.14 | 1.9 | 4.4 | 0.65 | 15 |
| Buenos Aires, Teatro Colo´n | 20 570 | 2487 | 1.56 | 1.72 | 1.23 | 1.1 | 2.4 | 0.65 | 18 |
| Chicago, Civic Opera House | 23 000 | 3563 | 1.51 | 1.49 | 1.32 | 2.1 | 0.3 | 0.53 | 41 |
| Dresden, Semperoper | 12 480 | 1300 | 1.60 | 1.83 | 1.23 | 0.8 | 2.7 | 0.72 | 20 |
| Essen, Opera House | 8 800 | 1125 | 1.61 | 1.90 | 1.31 | 1.3 | -0.4 | 0.54 | 16 |
| Hamburg, Staatsoper | 11 000 | 1679 | 1.23 | 1.35 | 1.12 | 2.2 | 1.3 | 0.46 | 34 |
| London, Royal Opera House | 12 250 | 2120 | 1.10 | 1.04 | 1.07 | 4.5 | 0.7 | 0.53 | 18 |
| Milan, Teatro alla Scala | 11 252 | 2289 | 1.24 | 1.14 | 1.26 | 3.6 | -0.3 | 0.48 | 16 |
| N.Y., Metropolitan Opera | 24 724 | 3816 | 1.47 | 1.62 | 1.07 | 1.7 | 0.5 | 0.62 | 18 |
| Paris, Ope´ra Garnier | 10 000 | 2131 | 1.18 | 1.16 | 1.31 | 4.6 | 0.7 | 0.50 | 15 |
| Prague, Staatsoper | 8 000 | 1554 | 1.23 | 1.17 | 1.29 | 3.1 | 2.2 | 0.64 | 16 |
| Rochester, Eastman Theater | 23 970 | 3347 | 1.63 | 1.90 | 1.32 | 0.8 | 3.6 | 0.54 | 22 |
| Salzburg, Festspielhaus | 14 020 | 2158 | 1.50 | 1.80 | 1.11 | 1.5 | 1.2 | 0.40 | 27 |
| Seattle, Opera House | 22 000 | 3099 | 2.02 | 2.50 | 1.26 | -0.4 | 2.7 | 0.48 | 25 |
| Tokyo, Bunka Kaikan | 16 250 | 2303 | 1.51 | 1.75 | 1.18 | 1.1 | 0.3 | 0.56 | 14 |
| Tokyo, New National Theater | 14 500 | 1810 | 1.49 | 1.70 | 1.07 | 1.6 | 1.7 | 0.65 | 20 |
| Tokyo, Nissei Theater | 7 500 | 1340 | 1.11 | 1.06 | 1.24 | 4.4 | 5.3 | 0.58 | 17 |
| Vienna, Staatsoper | 10 665 | 1709 | 1.36 | 1.43 | 1.19 | 2.7 | 2.8 | 0.60 | 17 |
| Washington, JFK Center, Opera House | 13 027 | 2142 | 1.28 | 1.27 | 1.21 | 4.3 | 3.1 | 0.53 | 15 |
RT, BR, C80, G and IACC in Opera Houses (measured by the Takenaka R. & D. Institute and Beranek)
Measurement source: omnidirectional loudspeaker (dodecahedral) in the orchestra pit. Clarity is generally lower with the sound source in the pit, a favourable situation for symphonic music.
| Hall | RT,occupied (sec) | BR, occupied | C80(3) (dB) | G (dB) | IACCE3 |
| Buenos Aires, Teatro Colo´n | 1.53 | 1.19 | -2.6 | 1.9 | 0.66 |
| Tokyo, New National Theater | 1.49 | 1.03 | -2.3 | 1.8 | 0.68 |
| Paris, Ope´ra Garnier | 1.15 | 1.19 | 0.3 | 0.1 | 0.65 |
| Prague, Staatsoper | 1.21 | 1.28 | -0.4 | 2.5 | 0.67 |
| Vienna, Staatsoper | 1.35 | 1.12 | -0.5 | 4.0 | 0.65 |
| NY, Metropolitan Opera | 1.48 | 1.07 | -2.3 | 0.2 | 0.63 |
| Hamburg, Staatsoper | 1.23 | 1.09 | -0.7 | 1.4 | 0.57 |
| Berlin, Deutsche Oper | 1.32 | 1.28 | -1.4 | 1.0 | 0.54 |
| Chicago, Civic Opera House | 1.52 | 1.26 | -0.2 | -2.1 | 0.66 |
| Amsterdam, Music Theater | 1.29 | 1.20 | -1.4 | 0.3 | 0.61 |
| Essen, Opera House | 1.46 | 1.25 | -0.6 | -0.1 | 0.71 |
| Tokyo, Bunka Kaikan | 1.49 | 1.15 | -0.5 | | 0.58 |
| Washington, JFK Center, Opera House | 1.25 | 1.13 | 2.1 | 1.3 | 0.58 |